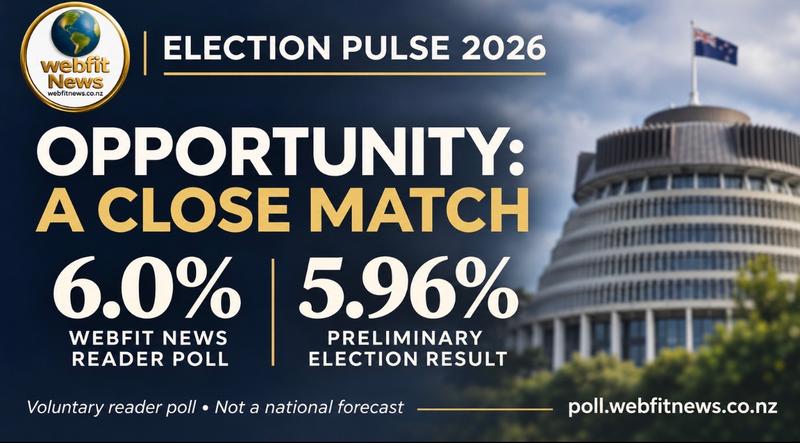
The Election Pulse dashboard, displaying a last-updated timestamp of 27 October, records Opportunity on 6.0 percent.
The Electoral Commission’s preliminary result puts the party on 5.96 percent, with seven projected MPs. Rounded to one decimal place, the figures match.
That is a noteworthy comparison for the readers who participated and the team behind the project. It deserves to be examined alongside the full results.
|
Party
|
Webfit News reader dashboard
|
Preliminary party vote
|
|
National
|
24.7%
|
29.21%
|
|
Labour
|
22.0%
|
29.36%
|
|
ACT
|
15.4%
|
10.92%
|
|
New Zealand First
|
15.4%
|
9.78%
|
|
Greens
|
13.2%
|
13.30%
|
|
Opportunity
|
6.0%
|
5.96%
|
|
Te Pāti Māori
|
0.5%
|
0.57%
|
Opportunity, the Greens and Te Pāti Māori recorded close numerical readings. The differences for National, Labour, ACT and New Zealand First were larger.
Publishing the complete comparison matters. Readers should be able to see where their collective responses resembled the election result and where they differed.
How we ran Election Pulse
Readers could select an electorate and submit their current party preference. The dashboard combined responses across those electorate polls.
It offered two views: a combined participant share and an equal-electorate average.
In the first, electorates attracting more responses contributed more to the total. In the second, each electorate with responses received equal weight.
Those views helped readers explore submissions from different angles. Neither made the responses nationally representative.
Participation was voluntary. Results were not weighted by age, geography, ethnicity or previous voting behaviour. The dashboard identified them as participant preferences rather than an election forecast.
Election Pulse was a pre-election reader poll, rather than an exit poll. Exit polls ask people about votes they have already cast. Our project asked participants about their preferences.
The comparison also involves different measures: dashboard responses included undecided and other categories, while official party-vote percentages describe valid votes cast.
Looking beyond Luxon versus Hipkins
On 7 October, Webfit News examined declining combined support for Labour and National and the potential influence of smaller parties.
Our coverage considered how support beyond the two largest parties could affect government formation. It also distinguished national polling from our own reader responses.
The early reader snapshot placed Opportunity at 11.1 percent, substantially above its later dashboard reading. That changing picture belongs in any assessment of the project.
Our contribution was to bring readers into the discussion and explain why smaller parties, potential partners and parliamentary arithmetic deserved attention before election night.
Reader percentages alone could not establish a hung Parliament, identify a kingmaker or determine whether the incumbent coalition would return.
From preferences to official results
Once counting began, the task changed.
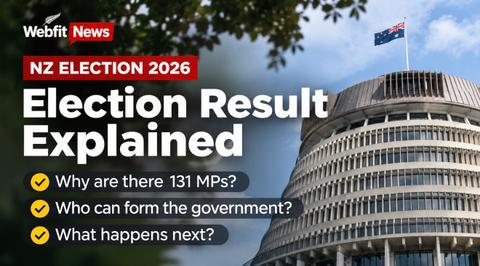
The results portal brought together nationwide party votes, projected parliamentary seats and electorate contests. It highlighted close margins and explained the next stages of counting.
The underlying election figures came from the Electoral Commission. Webfit News’s contribution was their presentation, organisation and explanation.
The portal distinguished preliminary results from the final outcome. It explained that all voting places reporting did not mean every vote had been counted, and displayed the majority threshold alongside projected seat totals.
That context matters when readers are following a tight election.
A party leading the nationwide vote is not necessarily the party with the most seats. A projected grouping is not a signed coalition agreement. A page checking for updates does not mean additional votes have been counted.
The purpose was to help readers understand the result as well as see it.
What the numbers currently establish
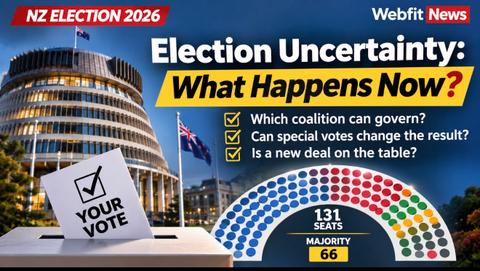
National, ACT and New Zealand First hold 67 projected seats between them in a projected 131-member Parliament. An outright majority requires 66.
Opportunity’s seven projected MPs give it a significant parliamentary presence. They do not automatically make it a kingmaker.
On the preliminary allocation, the existing governing parties have a majority without Opportunity, provided they agree to govern together.
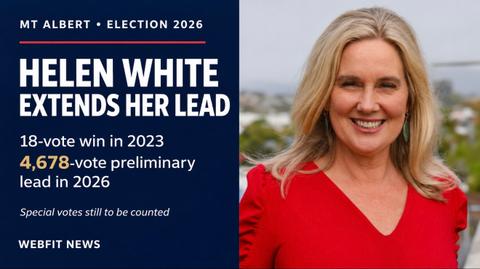
Special votes could change that arithmetic. Until the official count is complete, possible governing arrangements must remain clearly separated from confirmed outcomes.
Accountability is part of the work
Building Election Pulse meant creating a place for participation and helping readers interpret what they were seeing.
Its credibility depends on explaining how responses were collected, keeping reader preferences separate from official election results and acknowledging where comparisons fall short.
The close Opportunity reading is worth recognising. So are the differences elsewhere.
Readers gave their time to the project. They deserve a complete account of what their participation showed.
Official results are scheduled for 27 November. Webfit News will review the final figures and continue explaining what they mean for the next Parliament.
Webfit News polling and election coverage
Reader dashboard: poll.webfitnews.co.nz/election-pulse-2026
Election results: poll.webfitnews.co.nz/results-2026
Sources: Webfit News Election Pulse dashboard, published election coverage and results portal; Electoral Commission preliminary results.