
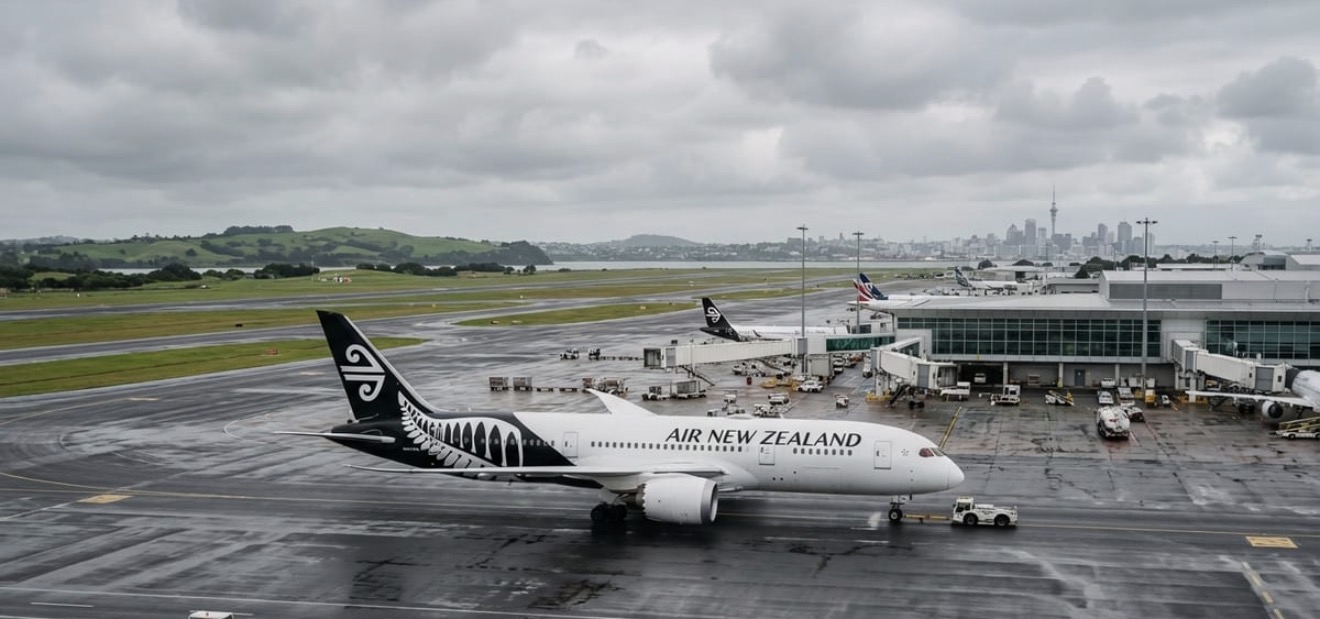
Air New Zealand is celebrating a punctuality improvement for August, but a closer look at the numbers shows the airline is still recovering from a genuinely rough July, and roughly one in seven flights still didn't arrive within 15 minutes of schedule.
According to the airline's own figures, 85.3 percent of flights arrived on time in August, up from 83.1 percent in July. That means 14.7 percent, still well over one in ten flights, missed that mark.
The Real Story Is the July Slump, Not Just the August Bounce
Framed on its own, an 85.3 percent on-time rate sounds solid. But the more revealing detail sits in the fine print: July was described by the airline's own Chief Operations Officer, Kate Boyer, as "a challenging" month, one with almost twice as many weather-affected flights and roughly two-and-a-half times the weather-related delay minutes compared to August.
In other words, August's "improvement" is partly just a return to more normal conditions after a particularly bad winter month, not necessarily evidence of a fundamental operational fix.
|
Month |
On-Time Rate (within 15 mins) |
|
August 2025 |
81.8% |
|
July 2026 |
83.1% |
|
August 2026 |
85.3% |
International Flights Were the Weakest Link
Dig into the breakdown by service type, and international flights stand out as the clear underperformer, even after improving.
|
Service Type |
August 2026 |
July 2026 |
August 2025 |
|
International |
80.4% |
74.5% |
76.2% |
|
Regional |
86.8% |
85.9% |
82.3% |
|
Domestic jet |
85.3% |
Not specified |
Not specified |
International punctuality jumped six points month-on-month, but it started from a notably weak 74.5 percent in July, meaning nearly a quarter of international flights were still missing their 15-minute window even after the "improvement."
Cancellations Are Still Happening
Beyond punctuality, the release also touches on cancellations, and this is where the framing gets interesting. The airline reports total cancellations fell from 2.8 percent in July to 2.5 percent in August. But it also specifically flags that 1 percent of scheduled flights were cancelled for reasons within Air New Zealand's own control.
That distinction matters. It means roughly 60 percent of August's cancelled flights were attributed to factors outside the airline's control (like weather), while the remaining 40 percent were, by the airline's own admission, avoidable.
Baggage: Good Compared to the World, But Still Thousands of Bags Go Missing
Air New Zealand's mishandled baggage rate, 2.77 bags per 1,000, is genuinely strong compared to the global average of 4.9 per 1,000. But raw rates can obscure raw numbers.
With 12.8 million bags carried across the year, a 2.77 per 1,000 mishandling rate works out to roughly 35,000 individual bags being delayed, damaged or lost over the course of the year, even at an "industry leading" rate.
Where Air New Zealand Actually Ranks Regionally
The airline highlighted that it placed fourth among Asia Pacific airlines for on-time performance in Cirium's monthly rankings. That's a solid result, but it's also worth noting explicitly: fourth means three other Asia Pacific carriers outperformed Air New Zealand on punctuality in August.
The Bottom Line
Air New Zealand's improved numbers for August are real, and beating the 73.1 percent global average for on-time performance is a genuinely fair point in the airline's favour. But the full picture is more nuanced than a straightforward good-news story: the airline is still climbing out of a rough July, nearly a quarter of international flights were still delayed even after improving, and a meaningful share of August's cancellations were within the airline's own control rather than down to weather.
For travellers deciding how much stock to put in these figures, the honest takeaway is this: Air New Zealand's performance is trending in the right direction and compares favourably to global averages, but "improved" and "reliable" are not quite the same thing yet, particularly for international travellers.
This article is based on a press release issued by Air New Zealand, with additional analysis of the figures provided.